
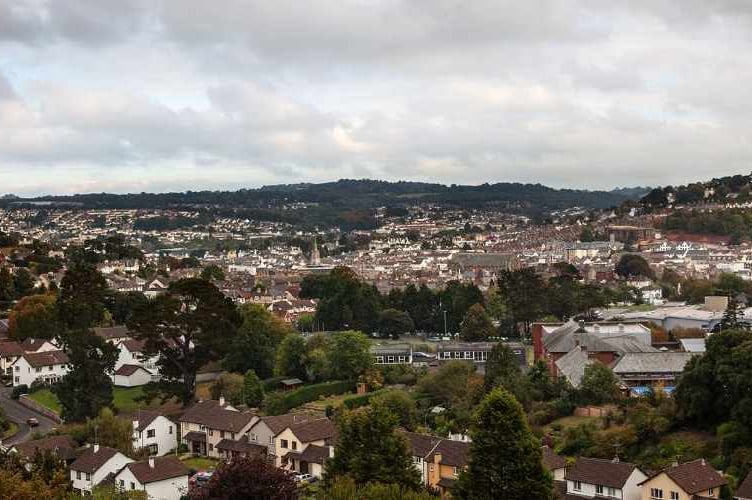
New figures from the Office for National Statistics have revealed that the average house price in Teignbridge has increased by £7,500 over the past year.
The UK’s house price statistics have been published by the Office for National Statistics (ONS).
According to the statistics, the median house price in Teignbridge is £280,000 as of March 2022, compared to £272,500 in March 2021.
The rise represents a £77,500 increase since March 2012, when the average Teignbridge house price was £195,000.

.jpeg?width=209&height=140&crop=209:145,smart&quality=75)


The cheapest place to buy a house in Teignbridge is Bushell, where the average house price is £218,000, down by £20,000 from last year’s £238,000.
The most expensive area is Shaldon & Stokeinteignhead, where the median house price for the year to March 2022 hit £457,500 - which is actually a big decrease from last year’s figure of £540,000, with a £82,500 difference between the two periods.
Other wards where prices dropped included Ashburton & Buckfastleigh, where averages were down from £279,950 to £240,000, Teign Valley, which saw a £72,500 drop from £417,500 to £345,000, and the College area of Newton Abbot, where averages were £236,500, down from £250,000.
However, many areas saw prices increase, with the average in Bradley rising from £235,000 to £259,500, and Buckland & Milber prices hitting £235,250, up from £209,250 in March 2021.
Teignmouth wards all saw increases, with the central area up from £268,000 to £270,000, the east up from £322,500 to £324,500, and the west increasing by £42,000 - up from £195,000 to £237,000.
There was also a rise in house prices in Chudleigh, where averages rose from £295,000 to £271,250.
Dawlish figures also rose during the period, with a slight increase in the south west - from £227,000 to £227,500 - and a more marked difference in the north east, which rose from £230,500 to £281,000.
The ONS explained how the data is collected: “The house price statistics for small areas (HPSSAs) use data from HM Land Registry.
“This is to provide statistics on the price paid and the number of residential property transactions for properties sold in each area in England and Wales.
“Properties sold at a discount to the market level, such as properties sold under the Right to Buy scheme, are not included in these statistics.”
The ONS also analysed how many property sales were made in the area in the period, reporting 2,348 residential property sales in Teignbridge in the year ending March 2022.
This is a slight decrease on March 2021’s total of 2,447, and a larger drop from the results of the year ending December 2021, which showed 2,804 sales in that period.
Comments
This article has no comments yet. Be the first to leave a comment.